
25 Important KPIs For Measuring Event Success


25 Important KPIs For Measuring Event Success .
When it comes to event measurement, the ultimate question on every organiser’s mind is, ‘How do I know if my event was a success?’ This article dives into 25 key performance indicators (KPIs) that provide a definitive answer.
From attendee feedback to financial returns, we break down the essentials of measuring your event’s impact, guiding you through a data-driven approach to understand precisely what worked and what can be improved for your future events.
Key Takeaways .
- Event measurement is a crucial process for evaluating an event’s success. It involves analysing data such as attendance rates, participant satisfaction, and social media engagement to guide future event planning and strategy.
- Key performance indicators (KPIs) for measuring event success range from fundamental metrics like attendance and conversion rates to more advanced aspects like lead generation, Net Promoter Score (NPS), session attendance, and sustainability metrics.
- The effectiveness of event measurement depends on selecting relevant metrics that align with an event’s objectives, using analytical tools efficiently, and applying insights gained to optimise future events and ROI.
Understanding Event Measurement
.

At its core, event measurement is a cyclical process that evaluates event success, serving as a guiding compass for businesses. It quantifies event impact and assesses the fulfilment of strategic objectives.
The cornerstone of event measurement lies in analysing various data types, including enhanced data. Details such as registration, feedback surveys, and social media analytics are not just numbers but a treasure trove of insights that can guide event planning strategies. In an era where personalisation is key, these data-driven decisions enable event planners to understand attendee preferences, efficiently allocate budgets and personalise events. This, in turn, enhances the attendee experience and paves the way for the success of future events.
Key Components of Event Measurement .
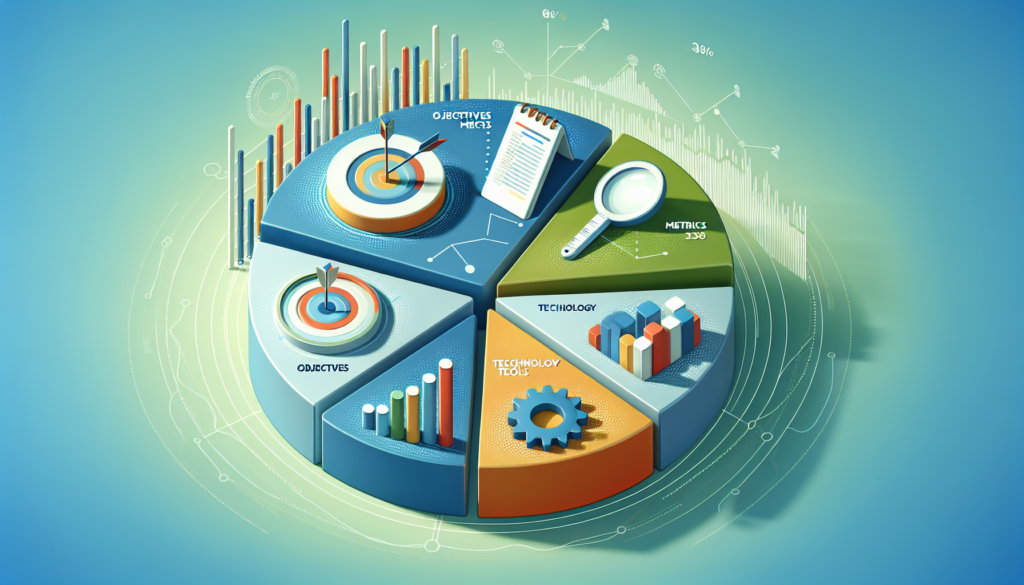
Event measurement is a tailored process that commences by defining objectives that align with the event’s primary goal. These objectives create a blueprint for the measurement process, directing the choice of pertinent metrics. Aggregated event measurement is crucial in this process, providing a comprehensive view of the event’s performance.
The selected metrics ought to mirror the event’s performance vis-à-vis its set objectives, which is crucial in measuring event success. However, the choice of suitable metrics is just the beginning. Data collection, analysis, and reporting efficiency hinges on utilising appropriate tools and technology, forming the foundation for assessing the event’s impact and achieving value optimisation.
1. Attendance Rate .
Attendance rate, a fundamental metric in event measurement, compares the total number of attendees to the expected or targeted number, giving a clear snapshot of the event’s reach.
2. Registration Conversion Rate .
Taking it a notch higher, the registration conversion rate determines the proportion of registered participants that made it to the conversion events. This provides insights into the efficacy of pre-event communication and the event’s attractiveness.
3. Lead Generation .
Beyond merely being a gathering, an event serves as a platform for creating new business opportunities, and unique events can further enhance this potential. Lead generation, which accounts for the new leads or contacts secured during the event, indicates future business potential.
4. Participant Satisfaction .
Considered one of the crucial metrics, participant satisfaction is determined by attendee feedback and satisfaction scores from surveys or post-event evaluations. This reflects the value attendees obtain from the event and their propensity to attend future ones.
5. Net Promoter Score (NPS) .
The Net Promoter Score (NPS) is a widely recognised industry metric. For events, it measures the likelihood of attendees recommending the event to others, serving as a proxy for attendee satisfaction and the event’s overall quality.
6. Social Media Engagement
.

In today’s digital era, the social media buzz surrounding an event is a potent indicator of its success. Social media engagement, encompassing:
- likes
- shares
- comments
- overall activity related to the event
A website’s success often mirrors its popularity and digital reach among users, making domain verification an essential step for businesses.
7. Online Mentions .
Alongside social media engagement, online mentions monitor the frequency of the event’s references online, including social media, blogs, and news articles. This offers a gauge of the event’s digital footprint and its scope for online visibility.
8. Media Impressions .
Media impressions offer a glimpse into the event’s media presence. This metric measures the total number of times event-related content is viewed across various media, helping to quantify the event’s exposure and outreach.
9. Return On Investment (ROI) .
Perhaps one of the most critical business metrics is the Return on Investment (ROI). It compares the event’s benefits, such as revenue and leads, to its costs. A positive ROI indicates that the event was not just a success, but a profitable venture.
10. Cost Per Lead
.
Cost per lead drills into the cost-effectiveness of lead generation at the event. It calculates the cost associated with acquiring each new lead during the event, providing insights into the event’s efficiency as a lead generation platform.
11. Exhibition Booth Traffic .
It’s essential to monitor booth traffic in events featuring exhibition booths or sponsor displays. This metric quantifies the visitor count to these booths or displays, showcasing their appeal and capacity to draw attendees.
12. Session Attendance
.
For multi-session events, tracking session attendance provides detailed insights. It tallies the participant count in each session or workshop, assisting in identifying:
- the most engaging topics
- the most pertinent topics
- the most engaging speakers
- the most pertinent speakers
This information is valuable for understanding attendee preferences and improving the next event, making it essential for an events manager to analyse value sets.
13. Speaker Ratings .
Speaker ratings offer another layer of feedback. They evaluate the quality of speakers and presentations based on attendee feedback, providing insights into the content quality and delivery at the event.
14. Networking Effectiveness .
For a significant number of attendees, networking opportunities constitute the value of an event. Networking effectiveness assesses the success rate of connections and interactions among attendees, mirroring the event’s efficacy as a relationship-building platform.
15. On-site App Engagement .
With the rise of digital technology, many web events now feature event-specific mobile apps. On-site app engagement tracks usage statistics for these apps, providing insights into their usefulness and the attendees’ digital engagement through user clicks.
16. Brand Exposure .
Brand exposure assesses the visibility and exposure of the event sponsors and partners. This metric is crucial for evaluating the value delivered to sponsors and partners and their return on investment.
17. On-time Arrival Rate .
The on-time arrival rate is another crucial event metric. It calculates the percentage of attendees who arrived on time for scheduled activities, reflecting the effectiveness of event scheduling and communication.
18. Dwell Time .
Dwell time is a measure of attendee engagement and interest. It measures the average amount of time attendees spend at the event, providing insights into the event’s ability to captivate and engage its audience.
19. Session Evaluations
.
Session evaluations are a deeper dive into the quality of the event’s content. They gather feedback on the content and delivery of individual sessions, offering granular insights to improve future content strategies.
20. Technology Adoption .
As events become increasingly digital, technology adoption becomes a vital metric. It evaluates the utilisation and effectiveness of event technology, such as event apps or virtual platforms, reflecting the event’s digital readiness and effectiveness.
21. Event Cost vs Budget
.
Financial control is an essential facet of event management. The comparison of actual event costs to budgeted amounts offers a glimpse into the event’s financial management and efficiency.
22. Post-Event Sales .
Events can notably influence post-event sales. This metric quantifies any surge in sales or business as a direct outcome of the event, signifying the event's success and sustained impact on business expansion. A well-prepared sales team can capitalise on this momentum to further enhance the results.
23. Social Media Follower Growth .
The aftermath of an event can also materialise in social media follower growth. This metric monitors the escalation in social media followers or engagement after the event, showcasing the event’s influence on the brand’s digital presence.
24. Sustainability Metrics .
In the current environmental consciousness era, sustainability metrics are a crucial component of event measurement. They quantify the event’s environmental impact and compliance with sustainability objectives, demonstrating its dedication to environmental accountability.
25. Post-Event Surveys
.
Finally, post-event surveys offer a comprehensive platform for gathering additional feedback and insights. These detailed surveys can reveal strengths, pinpoint areas for improvement, and provide a wealth of information for future event planning.
Summary .
In today’s data-driven world, measuring event success is not just a nice-to-have but a must-have. It allows businesses to quantify the impact of their events, assess strategic objectives, and generate actionable insights for future strategies.
The journey of event measurement begins with defining clear objectives, selecting relevant metrics, and leveraging the right tools and technology. This blog post has explored 25 key performance indicators vital for comprehensive event measurement. Each of these metrics, from attendance rate to post-event surveys, provides a unique perspective on the event’s success.
Remember, the ultimate goal of event measurement is to collect data and derive meaningful insights that can enhance future events. So, as you plan your next event, remember to measure, analyse, and learn. Every event is an opportunity to create memorable experiences, drive business growth, and set new benchmarks for success.
Frequently Asked Questions .
To track the success of an event, you can use indicators like the number of tickets sold and check-ins, post-event surveys, social media engagement, revenue generated, sponsors satisfaction surveys, post-event sales, and volunteer management. These indicators help evaluate different aspects of the event's performance and provide valuable insights for future planning.
You can measure event marketing success by tracking metrics such as unique registrations, qualified leads, attendee conversion rate, participant satisfaction, engagement metrics, and others. These measurements provide valuable insights into the effectiveness of your events.
Event measurement is important because it quantifies impact, assesses strategic objectives, and provides actionable insights for improved event strategies and enhanced attendee experiences. It helps understand event success and improve future strategies.
When measuring events, it's important to define event objectives, select relevant metrics, and use appropriate tools and technology for efficient data collection, analysis, and reporting. This helps ensure effectiveness and success in event planning and execution.